
Practical Design and a Use Case of Artificial Intelligence in Lymphoma Diagnosis with Vision Transformer using Weakly Supervised Training
Nghia (Andy) Nguyen1*, Amer Wahed1, Andy Quesada1, Yasir Ali1, Hanadi El Achi1, Y. Helen Zhang1, Jocelyn Ursua1, Alex Banerjee1, Sahib Kalra1, L. Jeffrey Medeiros2, and Jie Xu2
1Department of Pathology and Laboratory Medicine, The University of Texas McGovern Medical School, Houston, Texas
2Department of Hematopathology, The University of Texas MD Anderson Cancer Center, Houston, Texas
*Corresponding author: Professor. Nghia (Andy) Nguyen, MD, Department of Pathology and Laboratory Medicine, The University of Texas McGovern Medical School, 6431 Fannin, MSB 2.224, Houston, TX, 77030, USA; E-mail: nghia.d.nguyen@uth.tmc.edu
Received: 17 July 2026; Revised: 07 August 2026; Accepted: 11 August 2026; Published: 18 August 2026
Copyright:© 2026 Nguyen N (Andy). This is an open-access article distributed under the terms of the Creative Commons Attribution License, which permits unrestricted use, distribution, and reproduction in any medium, provided the original author and source are credited.
Citation: Nguyen N (Andy), Wahed A, Quesada A, Ali Y, El Achi H, Zhang YH, et al. (2026) Practical Design and a Use Case of Artificial Intelligence in Lymphoma Diagnosis with Vision Transformer using Weakly Supervised Training. 21st Century Pathology, Volume 6 (1): 163
Abstract
Vision transformers (ViT’s) have been shown to allow for more flexible feature detection and can outperform convolutional neural network (CNN) when pre-trained on sufficient data. Due to their promising feature detection capabilities, we deployed ViTs as artificial intelligence (AI) tools for morphological classification of anaplastic large cell lymphoma (ALCL) versus classic Hodgkin lymphoma (cHL). We had previously designed a ViT model which was trained on a small dataset of 1,200 image patches in fully supervised training. That model achieved a diagnostic accuracy of 100% and an F1 score of 1.0 on the independent test set. Since fully supervised training is not a practical method due to lack of expertise resources in both the training and testing phases, we conducted a recent study on a modified approach to training data (weakly supervised training) and show that labeling training image patch automatically at the slide level of each whole-slide-image is a more practical solution for clinical use of Vision Transformer. Our ViT model, trained on a larger dataset of 100,000 image patches, yields evaluation metrics with significant accuracy, F1 score, and area under the curve (AUC) at 91.85%, 0.92, and 0.98, respectively. These are respectable values that qualify this ViT model, with weakly supervised training, as a suitable tool for a deep learning module in clinical model development using automated image patch extraction. Due to the limitations of the current ViT model in routine clinical practice (inclusion of only ALCL vs. cHL and only H&E histology), emphasis is placed on its utilization as a rule-out tool rather than as a strictly diagnostic tool. This utilization is well illustrated in the use case described in the Results section.
Keywords
Vision transformer; Weakly supervised training; Deep learning; Hodgkin lymphoma; Anaplastic large cell lymphoma; Use case
Introduction
Machine learning consists of software that can learn from and make predictions on data - i.e., “gives software the ability to learn without being explicitly programmed.” Numerous machine learning methods have been attempted in the past with varying degrees of success, including decision trees, cluster analysis, support vector machines, random forests, Bayesian analysis, regression analysis, neural networks, and large language models (LLMs) [1]. Deep learning (DL) is the most recent and most disruptive method of machine learning, based on neural networks and LLM. Currently, many large companies (e.g., Google, Microsoft, OpenAI) are analyzing large volumes of data for business analysis and decision-making, utilizing deep learning technology [2,3]. The application of DL to digital pathology has shown potential to impact personalised diagnostics and treatment. Breakthroughs in DL occurred in 2006, enabling it to outperform other machine learning models. DL algorithms include two critical features: first, unsupervised learning enables a network to be fed raw data (with no known outcomes) and automatically discover the representations needed for detection or classification; and second, supervised learning extracts high-level, complex data representations. DL has benefited substantially from supporting hardware that facilitates parallel computation, a distinct feature of matrix multiplication, through a graphics processing unit (GPU) [4], which performs better than a central processing unit (CPU).
Lymphoma is a haematological malignancy, and the current classification of lymphoid malignancies by the World Health Organization is extensive [5]. Worldwide, 280,000 people have been diagnosed with lymphoid neoplasms annually. Lymphoma is typically first suspected based on its growth pattern and the cytologic features of the tumor cells, evaluated by light microscopy of hematoxylin-eosin-stained (H&E) tissue sections. Immunophenotypic features are typically needed for diagnosis, as determined by flow cytometry and/or immunohistochemical analyses. Additionally, cytogenetic results, molecular findings, and clinical features are often necessary to confirm the diagnosis or for prognostication. Anaplastic large cell lymphoma (ALCL) and classic Hodgkin lymphoma (CHL) are two distinct types of lymphoma that share some overlapping features (Figure 1) [5].
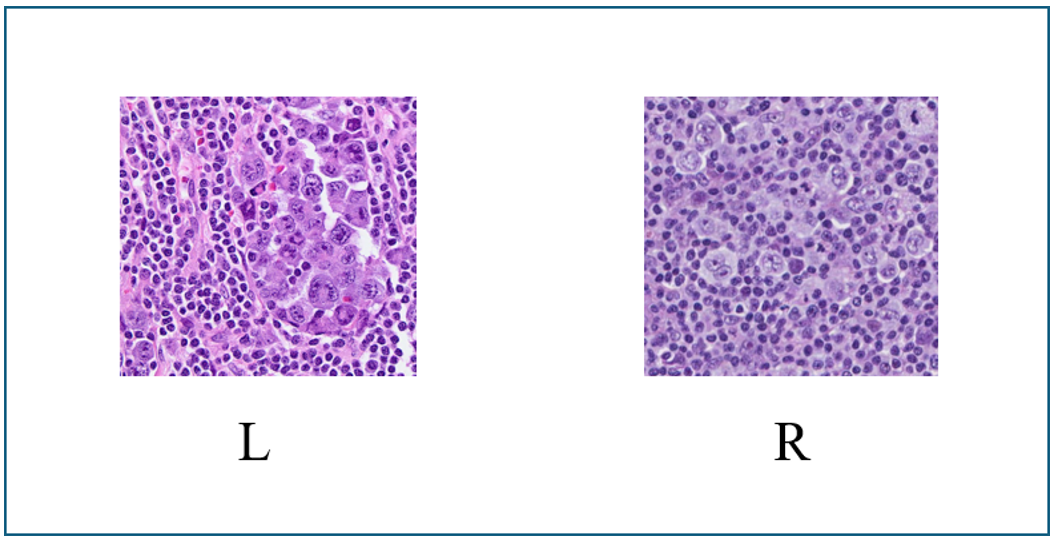
Figure 1: Representative histology of anaplastic large cell lymphoma (L) and classical Hodgkin lymphoma (R).
ALCL is a rare subtype of peripheral T cell lymphoma (PTCL) that can present in different forms, including primary cutaneous ALCL and systemic ALCL. CHL is a more common type of lymphoma, characterized by the presence of Hodgkin-Reed-Sternberg (HRS) cells in lymphoid tissue. Both types of lymphoma are marked by the presence of CD30 on the surface of the neoplastic cells, among other characteristic features. These neoplasms require careful diagnosis, as different treatments are required to manage each disease effectively. The choice of treatment depends on the specific characteristics of the lymphoma and the patient's overall health. Due to subtle differences in histologic features between these two types of lymphomas, their diagnosis can represent a challenge to pathologists. Applying automated diagnostic tools that utilize whole-slide imaging (WSI) can help pathologists enhance diagnostic precision and efficiency. Earlier attempts to classify histologic images using features such as nuclear shape, size, and texture were largely unsuccessful [6], prompting the adoption of DL algorithms, particularly convolutional neural network (CNN) and vision transformer (ViT), which now represent the state-of-the-art in computer vision [7,8].
Convolution in CNN is an operation in image processing that uses filters to modify or detect specific characteristics of an image, such as smoothing, sharpening, intensification, or enhancement. Mathematically, a convolution is done by multiplying the pixel value in the image patch by a filter matrix (kernel) to yield a dot product. By moving the filter across an input image, one obtains the final output as a modified filtered image [9]. Recently, ViTs were shown to be capable of outperforming CNNs when pretrained on sufficient amounts of data [10-15]. In comparison to CNNs, ViTs have a weaker locality bias and therefore allow a more general feature detection (multi-modal data). ViTs are direct applications of transformer models based on a Large Language Model (such as ChatGPT and CoPilot) to vision analysis (Figure 2).
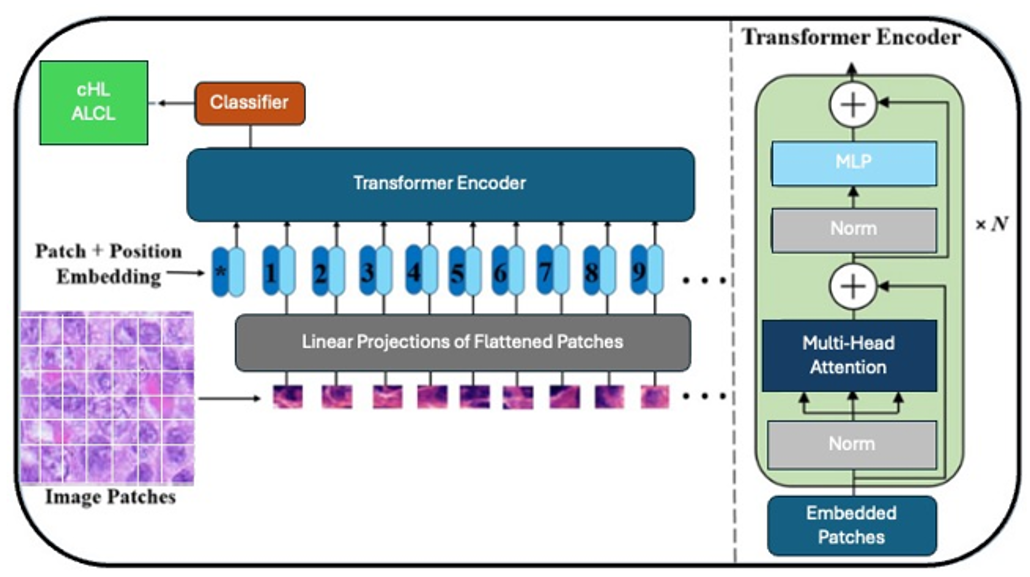
Figure 2: Vision Transformer (ViT) for image classification: the input image is split into smaller patches, where they are flattened, projected into vectors, and combined with positional embeddings. The Transformer Encoder utilizes N layers of multi-head attention, fully connected layers to process embeddings. A Multilayer Perceptron (MLP) is a feed-forward neural network where the information moves from the input layer to the output layer, passing through one or more hidden layers. The classifier outputs the final classification (e.g., "ALCL" or "cHL").
While the transformer architecture (based on a Large Language Model) has become the de facto standard for natural language processing tasks, its applications to computer vision remain limited. It was shown that applying the Transformer algorithm directly to sequences of image patches can perform very well on image classification tasks. In 2021, Alexey Dosovitskiy et al. successfully deployed a ViT model for image analysis [16]. They demonstrated that a pure transformer applied directly to sequences of image patches can achieve high performance on image classification tasks. The pixel is the most basic unit of measurement in an image, but calculating every pixel relationship in a normal image would be memory-intensive. Instead, ViT takes several steps, which require dividing the entire image into a grid of small image patches, then applying linear projection to embed each patch, with consideration for the position of each image patch in the image; each embedded patch becomes a token, and the resulting sequence of embedded patches is passed to the transformer encoder (Figure 2). Self-attention in ViT allows each part of an image to relate (pay attention) to other parts of the image, regardless of the distance between them. The input patches are processed using multi-head attention, and the output is fed into a multilayer perceptron (MLP), which produces the resultant classes, such as tumor types, in a tumor classifier. Due to their promising feature detection capabilities, we deployed ViTs for morphological classification of anaplastic large cell lymphoma (ALCL) versus classic Hodgkin lymphoma (cHL), using morphology data from whole-slide-images (scanned images from microscopic slides). In a previous study [17], we showed that ViT achieved a high diagnostic accuracy and F1 score on an independent test set. In that study, we used manually annotated image samples for training and testing (supervised learning), a time-consuming task that requires expert knowledge from pathology specialists. Our vision transformer model demonstrated accurate and consistent performance in classifying ALCL and cHL. On the independent test set, at Epoch 200, the model achieved a diagnostic accuracy of 100% and an F1 score of 1.0, matching the performance of our previously developed CNN model [18], which was also deployed on the same dataset. A confusion matrix was constructed to evaluate the model’s final performance, showing no misclassifications. Possible reasons for the high accuracy of ViT in that study included: manual labelling of cases by hematopathologists, rigid inclusion constraints of WSI (all WSIs were scanned by the same scanner in the same laboratory), and only two types of lymphomas to predict by the model.
Traditional works on computational microscopic pathology are based mainly on supervised training algorithms [19]. These algorithms usually require pathologists’ annotation of image patches on whole slide images (WSIs). The selected image patches are then used to train a supervised machine learning algorithm for inference tasks on histopathology images. Owing to the requirement of manual annotation by pathologists, such methods have limitations in real-world applications because accurate annotations from pathologists are difficult to obtain. This difficulty applies to both training and testing data. In light of the weaknesses of such methods, ‘weakly-supervised training algorithms’ have been developed in recent years [20]. Instead of requiring pathologists’ detailed annotation at image patch-level, such algorithms rely on automated image extraction and require only one annotation per WSI (slide-level annotation), which can be easily obtained directly from the patients’ electronic health records. In this study, we attempt to use weakly supervised learning, in which all image patches in a case under consideration are automatically annotated with the given diagnosis of the case. This approach is expected to significantly decrease training time and does not require specialist expertise in annotation since the annotation process is automated. The results from this study would be the first example of using ViTs for lymphoma diagnosis with weakly-supervised training.
Note that our DL model is limited to cHL vs. ALCL and it does not include other Lymphoproliferative disorders (LPD’s), often encountered in clinical practice. To make this ViT model useful for practical application, we explicitly specify the role for this application as a "rule-out" tool for cHL and ALCL.
According to this scheme:
-The initial findings include HRS-like cells and an inflammatory background that together suggest cHL
-The differential diagnosis would then include cHL, ALCL, and other LPD’s
-When an unknown case is tested by this DL program, the following would follow:
a. If cHL is predicted: the output would be "ALCL is ruled out; cHL and other LPD's should be considered"
b. If ALCL is predicted: the output would be "cHL is ruled out; ALCL and other LPD's should be considered"
A use case in Results section to rule out cHL will demonstrate how the ViT model for ALCL vs. cHL can be effectively used for specific steps in the diagnostic process.
Materials and Methods
We conducted a retrospective collection of cases with a previous diagnosis of cHL and ALCL, as defined by the current World Health Organization criteria [5], at our institutions from 2017 to 2025. We reviewed the morphological characteristics of each case. A total of 60 lymphoma cases (30 ALCL and 30 cHL) were collected from the University of Texas, McGovern Medical School Laboratory and the University of Texas MD Anderson Cancer Centre Hematopathology Laboratory. Whole-slide-image files were obtained by scanning the H&E glass slides using the Epredia P1000 scanner (3DHistech, Budapest, Hungary) with a scanning capacity for 1,000 glass slides, which produces high-quality images, full automation for focus, calibration, brightness and contrast settings, with tissue shape detection to outline and scan non-rectangular regions of interest for shorter turnaround times (Figure 3).
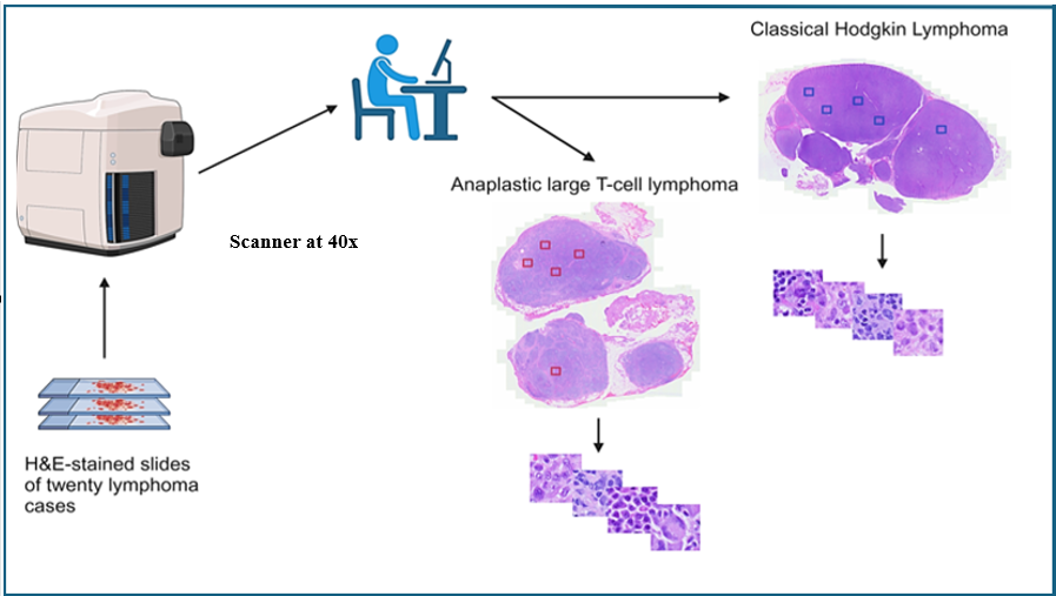
Figure 3: Lymphoma image processing workflow: 60 lymphoma cases stained with Hematoxylin and Eosin (H&E). Epredia P1000 scans slides at 40x magnification. Classical Hodgkin Lymphoma and Anaplastic Large T-Cell Lymphoma: two lymphoma types analyzed, shown with marked regions (blue and red squares). Image patches: 100x100 pixel patches were extracted from each lymphoma cohort for detailed analysis.
The total scan time for a 15 × 15 mm benchmark scan area at 40x resolution is less than or equal to 62 seconds. The images were acquired and converted to Slide Viewer Software (SVS) format (3DHistech, Budapest, Hungary), which was used to display the images. From each WSI, an average of 830 image patches with dimensions 100 × 100 were extracted at 20x magnification, yielding a total of 50,000 image patches. Image patches were extracted from segmented areas of scans automatically using weakly supervised training, in which all images in a case under consideration are automatically annotated with the given diagnosis of the case. Two automated image patch extraction methods were used (Figures 4 & 5).
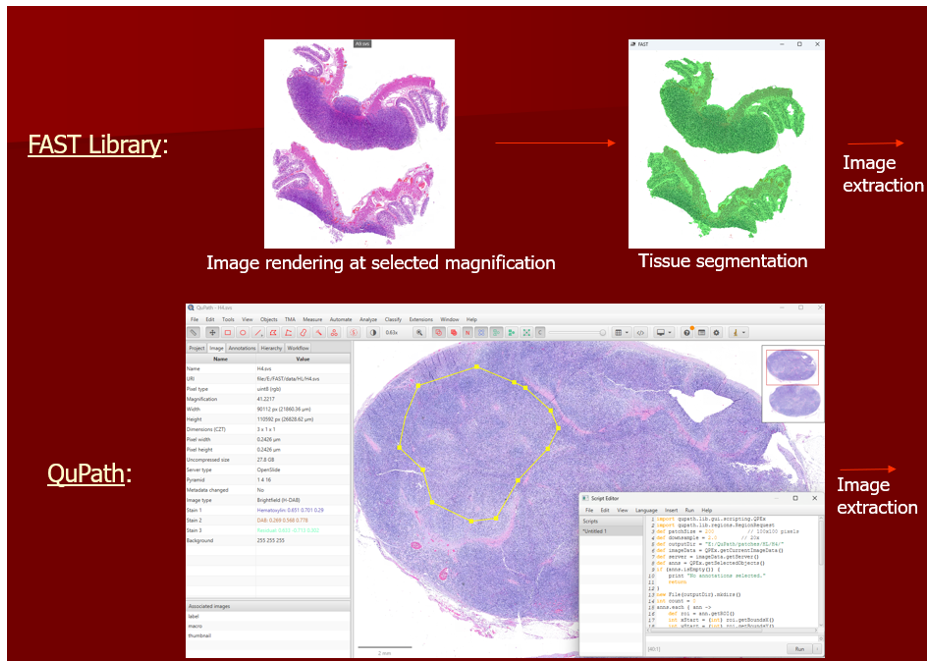
Figure 4: The workflow for two automated image extraction methods used in the study: FAST Python library (upper) and QuPath (lower).
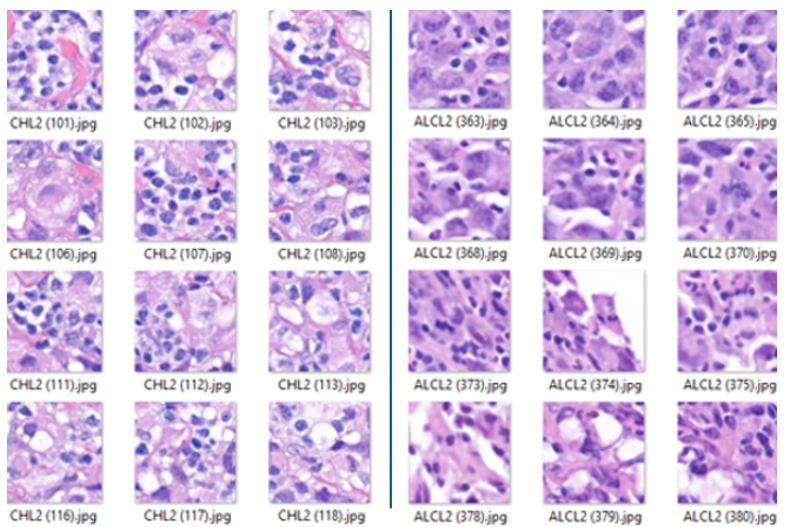
Figure 5: Examples of automated image patch extractions: from classical Hodgkin Lymphoma cases (L) and from Anaplastic Large Cell Lymphoma (R).
The first method is Python library FAST [21], an open-source framework developed by researchers at the Norwegian University of Science and Technology (NTNU), specifically useful for automated extraction of image patches utilizing multi-core CPUs and GPUs. The WSIs were segmented by FAST to obtain only the tissue area before image extraction. The second method is QuPath software [22], an open-source software developed at the University of Edinburgh, currently widely used for quantitative pathology and bioimage analysis. This software allows for automatic image extraction from annotated areas in WSIs, using Groovy script, an object-oriented language and is fully interoperable with Java [22].
Approximately 50,000 image patches (100x100 pixels) were automatically extracted for each method using weakly supervised training, the FAST Python library, and QuPath to create separate datasets. These patches were also combined to set up larger datasets of 100,000 image patches for analysis. The prediction performance of the ViT model using these two image patch extraction methods was also compared against each other to detect any discrepancy. The extracted patches were used for training and testing with a ViT model previously developed by our research group. Of these, 90,000 (90%) were used for training, and 10,000 (10%) were used for testing. The cases were divided into two cohorts, with 30 cases (50,000 image patches) for each diagnostic category. For the ViT model, the training set included 45,000 image patches from ALCL cases and 45,000 from cHL cases. The test set consisted of 5,000 image patches from ALCL cases and 5,000 from cHL cases.
A 7-fold validation was used for testing [7], in which 10% of the image patches were used as test patches each time, with the remaining 90% of the image patches used for training. The validation was performed seven times to rotate all image patches to testing category. This approach is used to ensure that the model does not predict a diagnosis based on memorizing the pattern from a particular case.
The ViT algorithm was written in Python using Torch, Torchvision, and Sklearn.metrics libraries (Python Software Foundation, Wilmington, Delaware, USA). Parallel processing was performed using dual NVIDIA RTX Pro 6000 Blackwell Max-Q GPU (NVIDIA Corp, Santa Clara, California, USA) with 96 GB of memory in each GPU for a total of 192 GB of memory, and 24,064 CUDA (Compute Unified Device Architecture) cores in each GPU for a total of 48,128 cores. Software methods utilized for multiple GPUs include Pytorch libraries for DistributedDataParallel (DDP) and Automatic Mixed Precision, and Windows Subsystem for Linux 2 (WSL2), which allows for running a Linux environment directly on Windows for faster AI training time. The CPU is an Intel Xeon W3-2525 CPU with 256 GB RAM. Windows 11 Professional for Workstations, 64-bit was the operating system (Microsoft Corp, Redmond, Washington, U.S.A.). The Institutional Review Board Ethics Committee approved the protocol for this retrospective study under the principles outlined in the Declaration of Helsinki. All cases in the study were deidentified to attain patient confidentiality, i.e., all H&E slides were scanned to obtain WSIs with consequential numbers without patient information. The WSI numbers were then associated with known diagnoses from previous reports to be used as a master table for the study.
To assess the prediction performance of the ViT model, binary classification metrics were used for evaluating the performance of our model, which predicts one of two possible outcomes (ALCL or cHL). The metrics consist of accuracy, F1 score, and area under the curve (AUC). The equations for these quantities are as follows [23]:
Accuracy= (TN + TP)/ (TN + FN + FP + TP)
Where: TN=True Negative
TP=True Positive
FN=False Negative
FP=False Positive
F1 Score = 2 (Precision x Recall)/ (Precision + Recall)
Where: Precision=TP/ (FP +TP)
Recall=TP/ (FN + TP)
Area Under the Curve (AUC):
Where: AUC is the area under the Receiver Operating Characteristic (ROC) curve with a maximum value of 1.00. AUC helps us to understand how well the model separates the true-positive cases from the false-positive cases.
Remoting to the DL workstation, where all datasets and codes reside, is used to let the study group members get access to the workstation and run train/test image patches regardless of their locations, which are spread over several clinical institutions. Quick Start guides and individual tutorials are given to study group members to get familiar with the remoting process. Results of classification metrics for various datasets are compiled from those obtained by group members.
Results
Table 1: Evaluation metrics and training time.
| Dataset size | Accuracy | AUC | F1 Score | Training time |
|---|---|---|---|---|
| 25k (FAST) |
84.84% | 0.91 | 0.81 | 1 hr 3 min |
| 25k (QuPath) |
82.80% | 0.87 | 0.72 | 1 hr 13 min |
| 50k (FAST) |
84.48% | 0.96 | 0.89 | 2 hr 5 min |
| 50k (QuPath) |
84.65% | 0.98 | 0.87 | 2 hr 10 min |
| 100k (FAST+QuPath) |
91.85% | 0.98 | 0.92 | 5 hr 8 min |
Production module for testing a new case
A production protocol for testing unknown images was established for the ViT-trained model to offer diagnosis prediction for new (unknown) images. Figure 6 illustrates a typical screen display for 5 unknown image patches. These image patches were obtained automatically from a WSI with unknown diagnosis (by any methods, including the two described in this article, FAST vs. QuPath). Five predicted diagnoses were shown by the pretrained ViT model, one for each image patch. The final diagnosis for the case was also given using majority voting, in which at least 3 of 5 predictions have to agree to be the final diagnosis [7]. In this example, all five image patches were predicted to be ALCL, and a final diagnosis of ALCL was suggested. Note that the run time for this production module is very short (1.45 sec in a typical run) since it utilized the pretrained model and did not have to go through training every time testing was needed.
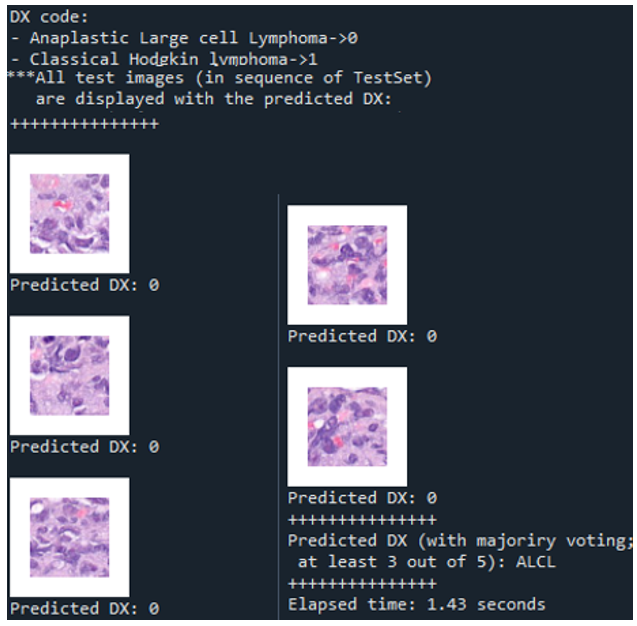
Figure 6: Screen display of the production module, predicting diagnosis for 5 unknown image patches from the same WSI, also with final diagnosis using majority voting.
A use case for our AI model to rule out cHL
In this section, we describe a use case for our ViT model of ALCL vs. cHL. In this case, cHL is ruled out with the assistance of our AI program based on an H&E image. This is an important part of the diagnostic process. Our use case is a vaginal biopsy from a 71-year-old female with a past medical history significant for rheumatoid arthritis treated with methotrexate and upadacitinib, who presented with vaginal bleeding and was found to have a 0.5–1.0 cm vaginal lesion. Biopsy of the lesion, collected and examined at the University of Texas, McGovern Medical School, demonstrated fragments of ulcerated squamous mucosa with an underlying dense atypical infiltrate involving the subepithelial tissue (Figure 7).
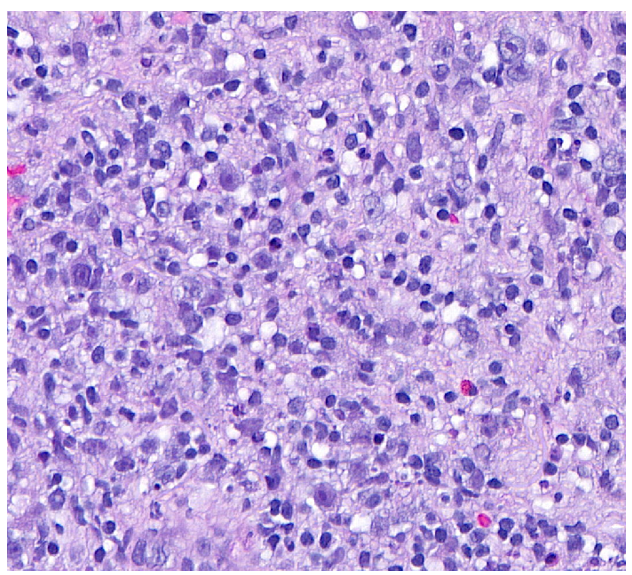
Figure 7: The infiltrate with sheets of large atypical cells, some with binucleated nuclei/prominent nucleoli (HRS-like cells), in the vaginal mucosa (H&E, 20X).
The infiltrate was composed of sheets of large atypical cells, some with binucleated nuclei/prominent nucleoli (HRS-like cells), with a background of inflammatory infiltrate consisting of small lymphocytes, plasma cells, eosinophils, and neutrophils. Numerous apoptotic bodies were present. With histologic findings alone, the differential diagnosis would include cHL vs. ALCL vs. other LPD’s. Our ViT model, using 3 test sets of image patches, ruled out cHL (Figure 8) and suggested that ALCL and other LPD’s should be considered.
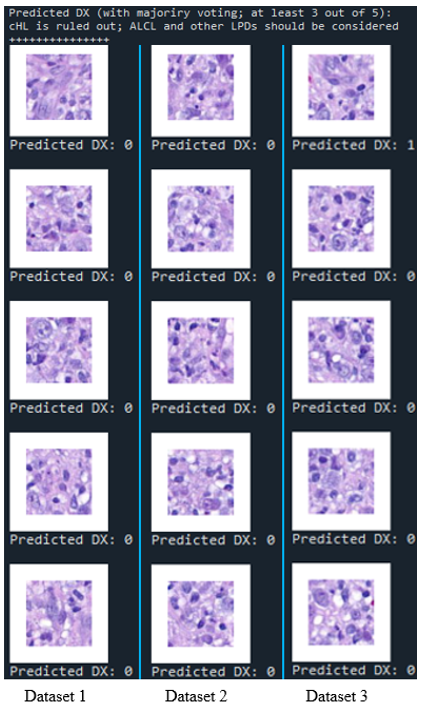
Figure 8: Screen display of the production module, ruling out cHL for each of the 3 sets of 5 unknown image patches from the same WSI, using majority voting.
Testing image patches (5 in each set) showed the following:
Set 1: 5 out of 5 exclude cHL
Set 2: 5 out of 5 exclude cHL
Set 3: 4 out of 5 exclude cHL
Subsequently, with immunohistochemical and special stains, the large abnormal cells are:
(+) for CD30, Ki67, EBER, PAX5, MUM1, and CD20 (subset)
(-) for CD15, GMS, Cytokeratin, TdT, S100, CD15, CD163, CD68, CD7, CD5, CD4, CD8, CD2, ALK1, CD10, bcl2, bcl6, and cyclinD1
With these immunophenotypic findings showing no T cell lineage, and also a lack of many mitotic figures, ALCL could be ruled out. The remaining differential diagnosis list would now include other B cell LPD’s. In the context of EBV positivity, immunosuppression, and a mucosal lesion, a diagnosis of Epstein-Barr virus mucocutaneous ulcer (EBVMCU) is the final diagnosis.
Note that our AI model is limited to cHL vs. ALCL and it does not include EBVMCU. However, the fact that it does not predict cHL is helpful for the rule-out step as outlined above. Again, this clearly shows that AI is very useful for histopathology diagnosis, but human judgement is still critical throughout the process to put everything together.
To recap, our AI model is limited to cHL vs. ALCL, and it does not include other LPD’s such as EBVMCU. To make this ViT model useful for practical application in daily practice, we explicitly specify the role for this application as a "rule-out" tool for cHL and ALCL due to its limitation. In this scheme:
-The initial findings must include HRS-like cells and an inflammatory background that together suggest cHL
-The differential diagnosis would then include cHL vs. ALCL vs. other LPD’s (note that our current model is limited to cHL and ALCL)
-When an unknown case is tested by this AI program, the following should be the output:
a. If cHL is predicted: the output would be "ALCL is ruled out; cHL and other LPD's should be considered"
b. If ALCL is predicted: the output would be "cHL is ruled out; ALCL and other LPD's should be considered"
Our use case of EBVMCU demonstrates how the ViT model for ALCL vs. cHL can be effectively used as a “rule-out” tool for specific steps in the diagnostic process. Note that the core logic of the ViT model is unchanged. Only the prediction output is rephrased in the rule-out process.
Discussion
To the best of our knowledge, our described research represents the first study using a ViT model for lymphoma diagnosis with detailed comparisons of the model’s prediction in different training modes (fully supervised vs. weakly-supervised). Using weakly-supervised training (labelling at slide level), the evaluation metrics (accuracy, F1 score, and AUC) progressively improved with increasing the number of image patches used in training datasets: 25k, 50k, and 100k. Our ViT model, trained on the largest dataset of 100,000 image patches, yielded significant evaluation metrics with accuracy, F1 score, and AUC at 91.85%, 0.92%, and 0.98%, respectively. These are respectable values that qualify the ViT model, with weakly supervised training, as a suitable tool for DL development using automated image patch extraction.
While CNN remains the most widely adopted architecture for medical image classification, due in part to its mature tooling and efficiency on smaller datasets, ViT has shown growing promise in the field of computer vision. Notably, ViT lacks the strong inductive biases of CNN, such as local spatial hierarchies, instead relying on global self-attention mechanisms. This design allows ViT to capture long-range dependencies and potentially generalize better to multimodal or heterogeneous data. Its performance is often constrained by the algorithm’s reliance on substantially larger datasets to achieve competitive performance, stemming from its data-hungry nature. Transformer-based models are also computationally intensive, particularly when processing large images, such as WSIs, where the self-attention mechanism incurs a quadratic computational cost that is directly proportional to the input size. These limitations have historically restricted the application of ViT in digital pathology, where images can span several gigapixels. Nonetheless, our study uniquely shows that with proper data curation and task formulation, ViT algorithms can perform comparably to CNNs in distinguishing lymphoma types. These findings have proven to hold true even on moderately large datasets (100k) as seen in our current study, challenging the prevailing view that ViT is restricted to only very large-scale pretraining scenarios in which patches in image datasets have to be in the range of millions.
Development of ViT models using fully supervised training is not a practical method due to a lack of expertise resources in both the training and testing phase. In this study, we used two automated methods to extract image patches and labeled them with diagnoses at the slide level, a technique used in weakly supervised training. The two methods (FAST vs. QuPath) yielded image datasets with comparable prediction results for the ViT model.
While CNN remains the most widely adopted architecture for medical image classification, due in part to its mature tooling and efficiency on smaller datasets, ViT has shown growing promise in the field of computer vision. Notably, ViT lacks the strong inductive biases of CNN, such as local spatial hierarchies, instead relying on global self-attention mechanisms. This design allows ViT to capture long-range dependencies and potentially generalize better to multimodal or heterogeneous data. Its performance is often constrained by the algorithm’s reliance on substantially larger datasets to achieve competitive performance, stemming from its data-hungry nature. Transformer-based models are also computationally intensive, particularly when processing large images, such as WSIs, where the self-attention mechanism incurs a quadratic computational cost that is directly proportional to the input size. These limitations have historically restricted the application of ViT in digital pathology, where images can span several gigapixels. Nonetheless, our study uniquely shows that with proper data curation and task formulation, ViT algorithms can perform comparably to CNNs in distinguishing lymphoma types. These findings have proven to hold true even on moderately large datasets (100k) as seen in our current study, challenging the prevailing view that ViT is restricted to only very large-scale pretraining scenarios in which patches in image datasets have to be in the range of millions.
Our current ViT prototype is a proof of concept for using DL as an assistance tool in clinical diagnosis. A busy pathologist may need a “second opinion” from DL for a difficult case in which a distinction between ALCL and cHL is not clear. The ViT model would also be useful in both ongoing and “look-back” QA protocols. If a discrepancy is seen between the pathologist’s diagnosis and the ViT model prediction, a second look by the pathologist would be warranted to assure that nothing has been overlooked in the diagnostic process. Conversely, there is no need for a second look if the pathologist’s diagnosis and the ViT model prediction agree with each other.
The main limitations of the current study are: (a) inclusion of only two lymphoma types (ALCL and cHL); and (b) only image patches from WSIs of H&E slides. No immunohistochemical (IHC) slide results were considered for data input to the ViT model. To effectively counteract these limitations of the current ViT model in routine clinical practice, emphasis is placed on its utilization as a rule-out tool rather than as a strictly diagnostic tool. This utilization is well illustrated in the use case described in the Results section. Future directions will explore more lymphoma types and additional data from other modalities such as IHC analysis and molecular results. Other limitations of the current study include: (c) diagnosis of all image patches in a WSI is taken from the reported diagnosis of the case, without further review to ensure that such diagnosis is correct; (d) performance has not been validated across larger and more diverse datasets, including variations in stain types and scanner brands. Standardizing heterogeneous stains in WSI relies on two main approaches: International Color Consortium (ICC) color calibration to align scanner output with true spectral values to reduce discrepancies between scanned color values and their true spectral equivalents, subsequently mitigating scanner-induced color variability within digital pathology workflows, and algorithmic stain normalization with Macenko, Vahadane, and modern deep-learning methods. These methods reduce inter-scanner and inter-lab variability, improving diagnostic consistency and AI model robustness [24]. Cross-institutional validation on various types of scanners will also be crucial to assessing model robustness in real-world settings; (e) no consideration for different magnifications to possibly enhance the classification metrics of the model (only 20x is used in the study). Future studies would require a preview of the cases by a panel of hematopathologists to ensure the accuracy of the reported diagnosis, normalization of stains [24], and using a multi-resolution model (such as 10x, 20x, 40x) to have image patches at various resolutions [25]. Lastly, AI-based tools have shown potential to optimize clinical workflows, enhance patient quality and safety, and facilitate personalized treatment. However, transitioning viable AI solutions to clinical implementation remains limited. There are multiple reasons behind this [26], with key items among them: (f) AI development focusing on innovative technologies may face limited success in large-scale clinical implementation, (g) current AI initiatives often generate knowledge without a clear path for implementing AI models once proof-of-concept is achieved. Our ViT model will face the same obstacles as other AI tools in the foreseen future as time progresses.
Conclusion
Our findings support a proof-of-concept for the feasibility and effectiveness of ViTs for lymphoma classification tasks in hematopathology. To the best of our knowledge, the results from this study are the first to use ViTs for lymphoma diagnosis with weakly supervised learning. These results would significantly expand the development of ViT models with more training data for lymphoma diagnosis. Weakly-supervised learning, as applied to ViT modelling, is expected to significantly decrease modelling time and does not require specialist expertise in annotation since the process is automated. Given the scalability, attention-based modeling, and adaptability to weakly-supervised training, the ViT-based architecture represents a promising avenue for future developments in computational pathology. Beyond predictive classification, ViT models hold immense potential as adjuncts in medical education, enabling trainees in pathology to engage in highly accurate computational tools and develop a more nuanced understanding of histologic features relevant to classification. As the field of pathology continues to adopt digital platforms, ViT-guided slide review may supplement both self-directed learning and traditional, instructor-led microscopy sessions, improving overall efficiency and proficiency. In clinical practice, ViT could provide utility as a diagnostic support tool, offering reassurance and reinforcement to pathologists in cases where a diagnosis is uncertain. Furthermore, by highlighting atypical or ambiguous morphologies, this model could serve to identify areas that may warrant additional review. This capability would be particularly valuable in settings with limited access to subspecialty expertise. As these applications materialize, integration into routine diagnostic workflows will require careful validation, optimization, and ongoing clinician oversight to ensure safe and effective use. Ultimately, with continued innovation in reducing their computational demands, ViT may emerge with an increasingly central role in the evolving landscape of digital diagnostics and clinical decision support.
References
- Razzak MI, Naz S, Zaib A. Deep learning for medical image processing: overview, challenges and the future. In: Dey N, Ashour A, Borra S, eds. Classification in BioApps. Springer; 2018:323-350. https://doi.org/10.1007/978-3-319-65981-7_12
- MIT Technol. Rev. 2013. Available at (last accessed on 10/30/18). https://www.technologyreview.com/s/513696/ deep-learning
- LeCun Y, Bengio Y, Hinton G. Deep learning. Nature. 2015;521:436-444. https://doi.org/10.1038/nature14539
- Janowczyk A, Madabhushi A. Deep learning for digital pathology image analysis: A comprehensive tutorial with selected use cases. J Pathol Inform. 2016;7:29. https://doi.org/10.4103/2153-3539.186902
- WHO Classification of Tumours Editorial Board. WHO classification of tumours: haematolymphoid tumours. 5th ed. Vol. 11. Lyon: International Agency for Research on Cancer; 2024.
- Choras RS. Feature extraction for CBIR and biometrics applications. In: Proceedings of the 7th WSEAS International Conference on Applied Computer Science. 2007;7:1-6.
- Marsland S. Machine learning: an algorithmic perspective. Boca Raton: Chapman and Hall/CRC; 2011.
- Mitchell TM. Machine learning. New York: McGraw Hill; 1997.
- Roy K, Banik D, Bhattacharjee D, Nasipuri M. Patch based system for classification of breast histology images using deep learning. Comput Med Imaging Graph. 2019;71:90-103. https://doi.org/10.1016/j.compmedimag.2018.11.003
- Waqas A, Bui MM, Glassy EF, et al. Revolutionizing digital pathology with the power of generative artificial intelligence and foundation models. Lab Invest. 2023;103(11):100255. https://doi.org/10.1016/j.labinv.2023.100255
- Vaswani A, Shazeer N, Parmar N, et al. Attention is all you need. In: Advances in Neural Information Processing Systems. 2017;31. https://doi.org/10.48550/arXiv.1706.03762
- Vorontsov E, Bozkurt A, Casson A, Shaikovski G, Zelechowski M, Severson K, et al. A foundation model for clinical grade computational pathology and rare cancers detection. Nat Med. 2024;30(10):2924-2935. https://doi.org/10.1038/s41591-024-03141-0
- Zhang J, Lu JD, Chen B, et al. Vision transformer introduces a new vitality to the classification of renal pathology. BMC Nephrol. 2024;25:337. https://doi.org/10.1186/s12882-024-03800-x
- Khedr OS, Wahed ME, Al Attar AR, et al. The classification of bladder cancer based on vision transformers (ViT). Sci Rep. 2023;13:20639. https://doi.org/10.1038/s41598-023-47992-y
- Beyer L, et al. Better plain ViT baselines for ImageNet 1k. Google Brain Research, Zurich. https://doi.org/10.48550/arXiv.2205.01580
- Dosovitskiy A, Beyer L, Kolesnikov A, et al. An image is worth 16x16 words: transformers for image recognition at scale. In: Proceedings of the International Conference on Learning Representations. 2021. https://doi.org/10.48550/arXiv.2010.11929
- Rivera D, Banerjee A, Zhang R, El Achi H, Wahed A, Ho L, et al. Vision transformers for diagnostic classification of lymphomas: a matched comparison with a convolutional neural network. 21st Century Pathol. 2025;5(1):160.
- Rivera D, Ali K, Zhang R, Mai B, El Achi H, Armstrong J, et al. Deep learning based morphological classification between classical Hodgkin lymphoma and anaplastic large cell lymphoma: a proof of concept and literature review. 21st Century Pathol. 2024;4(1):159.
- Mohri M, Rostamizadeh A, Talwalkar A. Foundations of machine learning. 2nd ed. Cambridge: MIT Press; 2018.
- Li Z, Cong Y, Chen X, et al. Vision transformer based weakly supervised histopathological image analysis of primary brain tumors. iScience. 2023;26:105872. https://doi.org/10.1016/j.isci.2022.105872
- Smistad E, Østvik A, Pedersen A. High performance neural network inference, streaming, and visualization of medical images using FAST. IEEE Access. 2019;7:1-12. https://doi.org/10.1109/ACCESS.2019.2942441
- Bankhead P, et al. QuPath: open source software for digital pathology image analysis. Sci Rep. 2017;7:16878. https://doi.org/10.1038/s41598-017-17204-5
- GeeksforGeeks. Evaluation metrics in machine learning. [cited 2026 Feb 25]. Available from: https://www.geeksforgeeks.org/machine-learning/metrics-for-machine-learning-model/
- Collins L, Heale R, Salmon RM. Color standardization in whole slide imaging: a method to reduce color variability. J Histotechnol. 2026. https://doi.org/10.1080/01478885.2026.2636401
- Chaurasia A, Toohey PW, Harris H, Hewitt AW. Multi resolution vision transformer model for histopathological skin cancer subtype classification using whole slide images. Comput Biol Med. 2025;196(Pt A):110724. https://doi.org/10.1016/j.compbiomed.2025.110724
- Leenen JPL, Hiemstra P, ten Hoeve MM, Jansen AC, van Dijk JD, Vendel B, et al. Exploring the complex nature of implementation of artificial intelligence in clinical practice: an interview study with healthcare professionals, researchers and policy and governance experts. PLOS Digit Health. 2025;4(5):e0000847. https://doi.org/10.1371/journal.pdig.0000847