Support for Trump and COVID-19 Death Rates
Author: Don Albrecht*
Director Western Rural Development Center, Utah State University, USA
*Correspondence to: Don Albrecht, Director Western Rural Development Center, Utah State University, USA; E-mail: don.albrecht@usu.edu
Received: March 26, 2022; Accepted: April 20, 2022; Published: April 28, 2021
Citation: Don Albrecht (2022) Support for Trump and COVID-19 Death Rates, 21st Century Pathology, Volume 2 (2): 117
Abstract
Abstract From March 1, 2021 until March 1, 2022, COVID-19 death rates in U.S. counties where Trump received more than 75 % of the vote in the 2020 presidential election were more than 3 times higher than in counties where he received less than 25 % of the vote. In Republican leaning counties, people were much less likely to be vaccinated and take other precautions to keep themselves safe from the disease. As a result, there were thousands of unnecessary deaths. To truly benefit from the tremendous medical breakthroughs that are occurring, it is critical that knowledge of and trust in science be substantially improved.
Keywords:
COVID-19; Infectious diseases; Human death
Introduction
For most of human history, infectious diseases have been a primary cause of human death. Since the 19th Century, a growing understanding of the role of microbes in infectious diseases has allowed a dramatic reduction in the impacts of these diseases. As a consequence, human lifespan and the quality of life have increased extensively [1]. Despite major advances in combatting infectious diseases, scientists and health experts have long recognized that there was a chance that a new disease could emerge for which humans had little or no natural defense [2-5]. Health experts hoped that if or when this new disease emerged, it could be contained more quickly and with less severe outcomes than previous pandemics because of vastly improved medical knowledge and the capacity of health experts to quickly communicate accurate and timely information to the general public.
Pandemic concerns became reality in December 2019 with the emergence of COVID-19. The disease quickly spread around the world and by March 20, 2022, the worldwide death toll was over 6.1 million people. In the United States, more than 970,000 people had died. The hope that improved medical knowledge and communication capacity could limit disease impacts was largely dashed by misinformation and science denial, which resulted in many people failing to follow best medical practices. Misinformation and science denial had a much greater impact in some places and among some segments of the population than others. As a consequence, disease consequences have been far worse in places where more people failed to follow medical best practices. For example, among OECD countries on March 20, 2022, deaths per 100,000 residents ranged from 460 in Hungary to 21 in Japan. These huge differences cannot be explained by medical factors alone and much of the variation is a result of large segments of the population in some places choosing to ignore recommended health practices.
Political views are a major factor in the widespread misinformation and science denial that have plagued some sectors of the population during the COVID-19 pandemic [6, 7]. To explore the relationship between political views and COVID-19 outcomes, this commentary will provide an overview of this relationship across more than 3,000 U.S. counties. U.S. counties provide an excellent platform to explore the relationship between political views and COVID-19 outcomes because both vary extensively from one county to another.
Politics and COVID-19 in the United States
Despite having all of the medical and communication advantages of an advanced country, pandemic responses in the U.S. were largely ineffective. As of March 20, 2022, the COVID-19 death rate in the U.S. was about 296 per 100,000, more severe than in most other developed nations. A major reason for the inadequate response in the U.S. is that the pandemic quickly became political. The reactions of the two major U.S. political parties to the pandemic were very different from one another, and common ground was difficult to find [8]. As with many other issues, Democrats were much more likely than Republicans to trust science [9-12] and thus take the threat of the COVID-19 virus seriously and respond accordingly [13-15]. In addition to the usual disagreements over individual freedoms vs. implementation of government restrictions, the COVID-19 pandemic was suffused with misinformation, scientific denial and conspiracy theories, often spread by elected officials. Consequently, federal policies were lacking, and state and local policies were disjointed and uneven [16, 17].
During the early months of the pandemic, while awaiting vaccine development, the only defense people had to combat the virus was to social distance and wear masks. Since Republicans tended to have lower perceptions of the danger of COVID-19 than Democrats, Republican controlled counties were much less likely than Democrat controlled counties to implement mask mandates and impose school and business closures to keep people apart [18]. The behavior of individual Republicans also tended to be riskier [13]. Fridman A, et al. (2020) found that persons consuming right-wing media had lower perceptions of disease risks and were more likely to believe conspiracy theories about the disease and vaccinations developed to combat it [19].
Later in the pandemic, vaccines provided a strong defense to disease spread and have saved vast numbers of lives [20, 21]. In the U.S., vaccines were first approved in December 2020, and by March 2021, most American adults had the opportunity to be vaccinated. Despite strong evidence to the contrary, misinformation about COVID-19 vaccines was rampant and included claims that the vaccine would alter one?s DNA, would negatively affect fertility, or the government was placing microchips in people to monitor and control their behavior [22]. Again, Republicans were more likely than Democrats to believe this misinformation, and thus less likely to get vaccinated [6, 23-26].
Because Republicans are less likely to be vaccinated and take other precautions to keep themselves safe, it is expected that the COVID-19 death rate per 100,000 residents will be greater in counties where the Republican candidate, Donald Trump received a larger share of the vote in the 2020 presidential election than in counties where he received fewer votes. It is expected that this relationship will be stronger following the availability of vaccines.
Methods
This analysis is based on all U.S. counties for which data is available (N=3,112). COVID-19 deaths for each county are obtained from the New York Times. The New York Times COVID-19 database consists of the cumulative number of deaths from COVID-19 for each county on a daily basis. These data are available to the general public and can be easily downloaded and analyzed. For this manuscript, data were downloaded on two dates, March 1, 2021 and March 1, 2022. This allows exploration of the first two years of the pandemic. The first year (until March 1, 2021) is prior to the time that vaccines were available to most people. The second year (from March 1, 2021 until March 1, 2022) is after most American adults had access to COVID-19 vaccinations. The actual dependent variable used in the analysis is the number of deaths from COVID-19 per 100,000 residents for each year of the study.
The independent variable is the percent of voters in each county that cast their ballot for Donald Trump in the 2020 presidential election. Counties are placed into 5 categories based on the percent of the votes that Trump received. The categories include 1) 75 % or more; 2) From 55 % to less than 75 %; 3) From 45 % to less than 55 %; 4) From 25 % to less than 45 %; 5) Less than 25 %.
Findings
Figure 1 presents the results of COVID-19 deaths per 100,000 residents by percent voting for Trump from the beginning of the pandemic until March 1, 2021. Figure 2 shows this same relationship from March 1, 2021, until March 1, 2022. During the first year of the pandemic, the relationship between political views and COVID-19 deaths per 100,000 was not especially strong, although death rates were highest in counties where Trump received more than 75 % of the vote. Since the availability of vaccines, the strength of the relationship is extremely strong (Figure 2). The death rate per 100,000 residents is more than 3 times higher in counties where Trump received more than 75 % of the vote than in counties where Trump received less than 25 % of the vote.
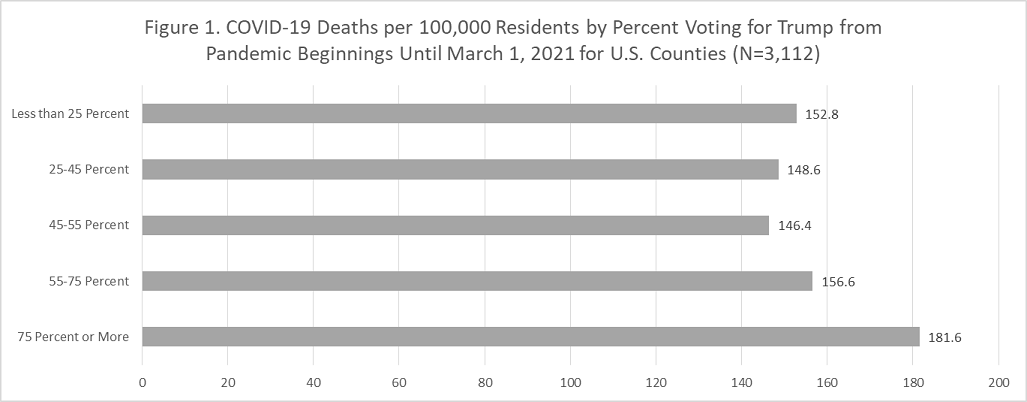
Figure 1: COVID-19 deaths per 100,000 residents by percent voting for Trump from pandemic beginnings until March 1, 2021 for U.S. counties (N=3,112).
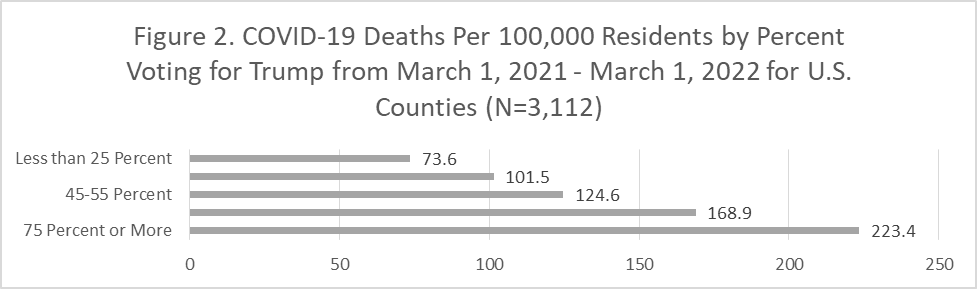
Figure 2: COVID-19 deaths per 100,000 residents by percent voting for Trump from March 1, 2021 - March 1, 2022 for U.S. counties (N=3,112).
Conclusion
Persons in Republican leaning counties were much less likely to take advantage of life-saving medical practices than persons in Democrat leaning counties. The consequence was that during the second year of the pandemic, death rates were more than 3 times higher in counties where Trump received more than 75 % of the vote relative to counties where he received less than 25 % of the vote. Thus, thousands of lives were lost unnecessarily. While advances in science and medicine have brought untold benefits to human societies, large segments of the population continue to reject science and fail to adhere to best medical practices. The world will likely face many other crises in the years and decades to come and it is vital to find ways to reduce misinformation and increase trust in science so that we can more effectively combat these crises.
References
1. Doig A. This Mortal Coil: A history of death. Bloomsbury Publishing; 2022 Feb 3.
2. Hatchett RJ, Mecher CE, Lipsitch M. Public health interventions and epidemic intensity during the 1918 influenza pandemic. Proceedings of the National Academy of Sciences. 2007 May 1;104(18):7582-7. https://doi.org/10.1073/pnas.0610941104
3. Lewis, Michael. 2021. The Premonition. New York: W.W. Norton.
4. Morens DM, Fauci AS. The 1918 influenza pandemic: Insights for the 21st century. The Journal of Infectious Diseases. 2007 Apr 1;195(7):1018-28. https://doi.org/10.1086/511989
5. Quammen D. Spillover: animal infections and the next human pandemic. WW Norton & Company; 2012.
6. Albrecht D. Vaccination, politics and COVID-19 impacts. BMC public health. 2022 Dec;22(1):1-2. https://doi.org/10.1186/s12889-021-12432-x
7. Albrecht D. Politics and the Spread of COVID-19 in the United States. Medical Research Archives. 2022 Feb 24;10(2). https://doi.org/10.18103/mra.v10i2.2681
8. Green J, Edgerton J, Naftel D, Shoub K, Cranmer SJ. Elusive consensus: Polarization in elite communication on the COVID-19 pandemic. Science advances. 2020 Jul 10;6(28):eabc2717. https://doi.org/10.1126/sciadv.abc2717
9. Graham BS. Rapid COVID-19 vaccine development. Science. 2020 May 29;368(6494):945-6. https://doi.org/10.1126/science.abb8923
10. Gauchat G. Politicization of science in the public sphere: A study of public trust in the United States, 1974 to 2010. American sociological review. 2012 Apr;77(2):167-87. https://doi.org/10.1177/0003122412438225
11. McCright AM, Dentzman K, Charters M, Dietz T. The influence of political ideology on trust in science. Environmental Research Letters. 2013 Nov 13;8(4):044029. https://doi.org/10.1088/1748-9326/8/4/044029
12. Oreskes, N. and E.M. Conway. 2011. Merchants of Doubt. Bloomsbury Publishing USA.
13. Calvillo DP, Ross BJ, Garcia RJ, Smelter TJ, Rutchick AM. Political ideology predicts perceptions of the threat of COVID-19 (and susceptibility to fake news about it). Social Psychological and Personality Science. 2020 Nov;11(8):1119-28. https://doi.org/10.1177/1948550620940539
14. Barrios JM, Hochberg Y. Risk perception through the lens of politics in the time of the COVID-19 pandemic. National Bureau of Economic Research; 2020 Apr 20.
15. Bruine de Bruin W, Saw HW, Goldman DP. Political polarization in US residents’ COVID-19 risk perceptions, policy preferences, and protective behaviors. Journal of risk and uncertainty. 2020 Oct;61(2):177-94. https://doi.org/10.1007/s11166-020-09336-3
16. Montez JK. US state polarization, policymaking power, and population health. The Milbank Quarterly. 2020 Dec;98(4):1033. https://doi.org/10.1111/1468-0009.12482
17. Montez JK, Beckfield J, Cooney JK, Grumbach JM, Hayward MD, Koytak HZ, Woolf SH, Zajacova A. US state policies, politics, and life expectancy. The Milbank Quarterly. 2020 Sep;98(3):668-99. https://doi.org/10.1111/1468-0009.12469
18. Hsiehchen D, Espinoza M, Slovic P. Political partisanship and mobility restriction during the COVID-19 pandemic. Public Health. 2020 Oct 1;187:111-4. https://doi.org/10.1016/j.puhe.2020.08.009
19. Fridman A, Gershon R, Gneezy A. COVID-19 and vaccine hesitancy: A longitudinal study. PloS one. 2021 Apr 16;16(4):e0250123. https://doi.org/10.1371/journal.pone.0250123
20. Harris JE. COVID-19 Incidence and hospitalization during the delta surge were inversely related to vaccination coverage among the most populous US Counties. Health policy and technology. 2021 Nov 30:100583. https://doi.org/10.1016/j.hlpt.2021.100583
21. Gupta S, Cantor J, Simon KI, Bento AI, Wing C, Whaley CM. Vaccinations against COVID-19 may have averted up to 140,000 deaths in The United States: Study examines role of COVID-19 vaccines and deaths averted in the United States. Health Affairs. 2021 Sep 1;40(9):1465-72. https://doi.org/10.1377/hlthaff.2021.00619
22. Hornsey MJ, Finlayson M, Chatwood G, Begeny CT. Donald Trump and vaccination: The effect of political identity, conspiracist ideation and presidential tweets on vaccine hesitancy. Journal of Experimental Social Psychology. 2020 May 1;88:103947. https://doi.org/10.1016/j.jesp.2019.103947
23. Hughes MM, Wang A, Grossman MK, Pun E, Whiteman A, Deng L, Hallisey E, Sharpe JD, Ussery EN, Stokley S, Musial T. County-level COVID-19 vaccination coverage and social vulnerability - United States, December 14, 2020 - March 1, 2021. Morbidity and Mortality Weekly Report. 2021 Mar 26;70(12):431. http://dx.doi.org/10.15585/mmwr.mm7012e1
24. Killgore WD, Cloonan SA, Taylor EC, Dailey NS. The COVID-19 vaccine is here - now who is willing to get it?. Vaccines. 2021 Apr;9(4):339. https://doi.org/10.3390/vaccines9040339
25. Viswanath K, Bekalu M, Dhawan D, Pinnamaneni R, Lang J, McLoud R. Individual and social determinants of COVID-19 vaccine uptake. BMC Public Health. 2021 Dec;21(1):1-0. https://doi.org/10.1186/s12889-021-10862-1
26. Zuckerman G. A Shot to Save the World: The remarkable race and ground-breaking science behind the Covid-19 vaccines. Penguin UK; 2021 Oct 28.